How to Reduce CPU Usage: Fix High Usage Fast
It’s 11 PM, your laptop fans are screaming, and Task Manager shows the CPU pegged at 100%. You didn’t open anything heavy. Yet the machine crawls.
Learning how to reduce CPU usage starts with one unglamorous truth: the fix is rarely “restart it and hope.”
We’ve combed through Microsoft’s own diagnostic documentation, Intel and AMD thermal specifications, and hundreds of user reports to map the real causes. In most cases, only one or two processes or hardware conditions are actually to blame. The trick is matching your symptom to the right fix instead of blindly closing tabs.
Here’s the diagnostic path that works in order.
how to reduce cpu usage
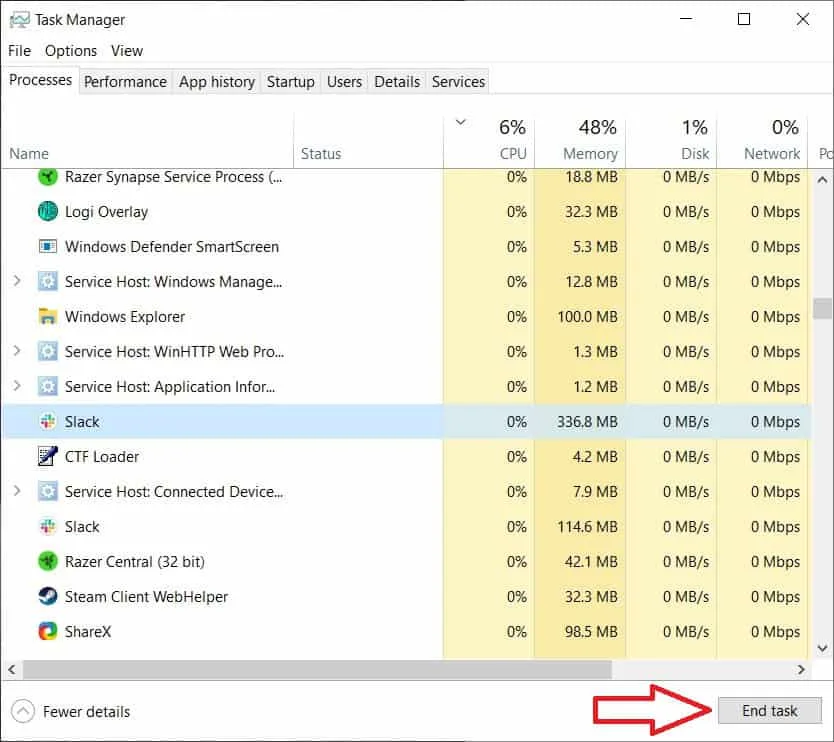
Open Task Manager, Activity Monitor, or top and sort by CPU percentage. Identify the exact process name first, never the total number. Disable unnecessary startup apps and background sync clients.
Scan for malware and update your drivers. Cap browser tabs and enable Memory Saver. If idle CPU stays under 5%, you’re done.
Why High CPU Usage Happens (and When It’s Actually a Problem)
High CPU usage isn’t always bad. When your CPU is working, it’s doing its job. The problem is sustained high usage when nothing demanding is running.
That’s when something is eating resources you didn’t authorize.
Here’s what the split usually looks like across symptoms:
| Symptom | Likely Cause | Urgency |
|---|---|---|
| One process at 40-100% | Runaway app or extension | Medium |
| Idle CPU 20-50% | Startup bloat, telemetry | Medium |
| 100% CPU + low speed | Thermal throttling | High |
| Mystery load, no visible app | Malware or driver bug | High |
Per Intel ARK documentation, modern CPUs throttle once they hit roughly 95-100°C on the package. When that happens, the chip drops its clock speed to protect itself. Task Manager still shows 100% usage, but the CPU is running at half its rated clock.
That’s why your machine feels slow even though “usage” looks busy.
Distinguish between idle usage (what the chip does when you’re not asking it to do much) and load usage (what it does under real work). Healthy idle sits under 5% on modern Windows 11 and recent macOS systems. Anything above 15% at idle deserves investigation.
Quick Answer: The 5-Minute Fix Most People Need
Most high CPU cases come down to one of four things: a runaway app, startup bloat, thermal throttling, or a hidden process. Before you dig deeper, try this sequence.
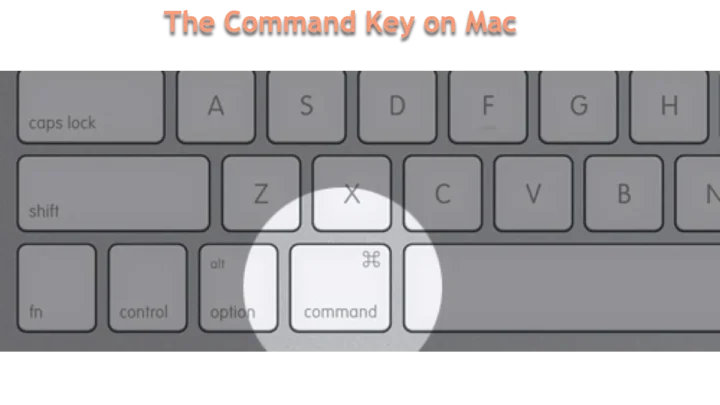
- Press Ctrl + Shift + Esc to open Task Manager (or Cmd + Space, type “Activity Monitor” on macOS).
- Click the CPU column header to sort descending.
- Note the top three process names, not just their percentages.
- Right-click the worst offender and choose End task (or Quit on macOS).
- Watch idle CPU for 60 seconds. If it drops below 5%, you’re fixed.
If CPU stays high after that, you’re dealing with a deeper cause. Restart into Safe Mode or a clean boot to isolate background services. Per Microsoft Support guidance, a clean boot disables non-Microsoft services and startup items, which narrows down what’s misbehaving fast.
Start Here: Open Task Manager, Activity Monitor, or top
You can’t fix what you can’t see. Every diagnostic path begins with opening the right monitor for your OS.
What to open on each system
- Windows 10/11: Task Manager (Ctrl + Shift + Esc), then More details if collapsed. For deeper data, open Resource Monitor (
resmon.exe) or Process Explorer from Microsoft Sysinternals. - macOS: Activity Monitor (Applications > Utilities). Sort by % CPU. Check the Energy tab for laptops.
- Linux:
top,htop, orglancesin a terminal.
How to read the numbers
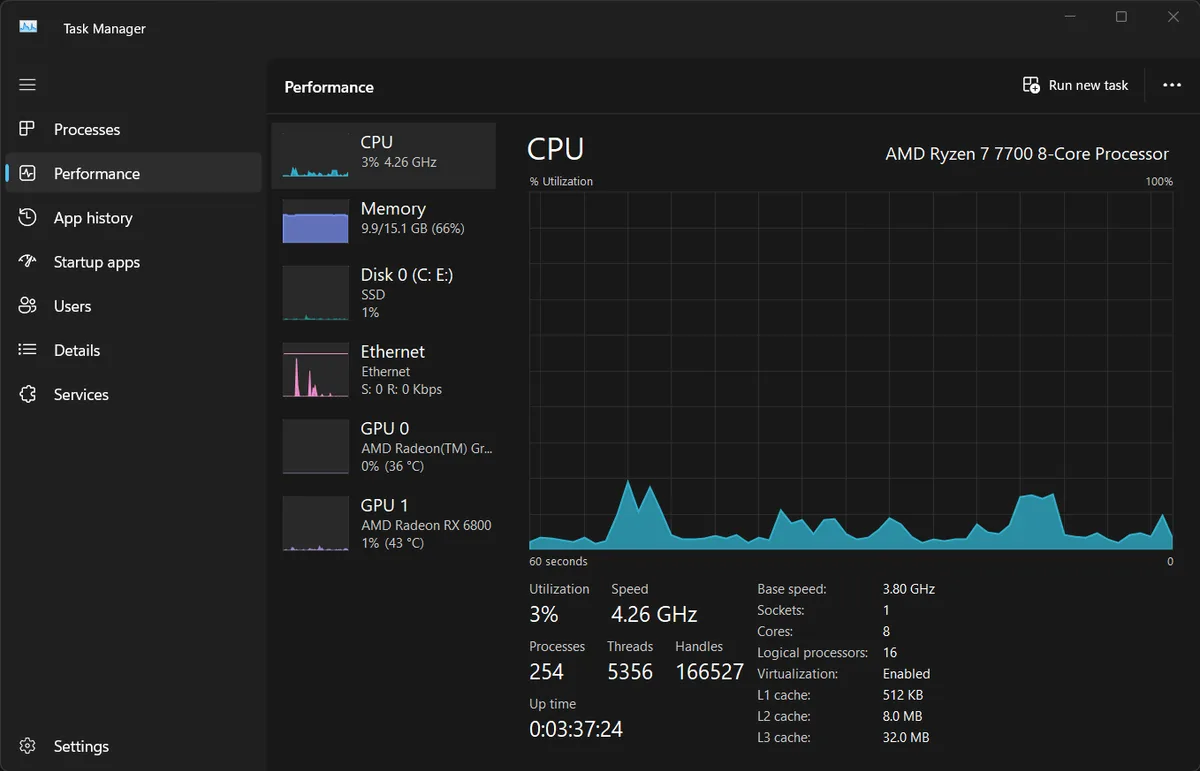
Focus on four columns: Name, CPU, Memory, and Disk. CPU percentage in Task Manager is normalized across all cores. So a process showing 12% on a 12-core machine is actually consuming one full core’s worth of work.
Check Details tab for the full process name and Publisher. If Publisher says “Unknown” or the name looks random, that’s a red flag.
Don’t trust the “System Idle Process”
That number represents unused capacity, not usage. If System Idle Process sits at 90%, your CPU is 10% busy. If it drops to 40%, something is chewing through 60% of your CPU.
When to escalate
If idle CPU stays above 20% after a clean boot, move to the branch sections below. If it’s under 10%, your machine is likely fine.
The Four Branches: Match Your Symptom to the Fix
This is the decision tree. Find the branch that matches what you’re seeing. Each one walks through the specific steps for that cause.
Branch 1: One Runaway Process (Chrome, svchost, SearchIndexer)
If one named process is hogging a core, kill it and investigate why. If it returns immediately, the underlying trigger (an update, a scan, a bad extension) is still active.
- Chrome/Edge: each tab and extension runs as a separate process. Disable extensions one at a time to find the offender. Enable Memory Saver in Chrome settings to suspend inactive tabs.
- svchost.exe: this hosts Windows services. Right-click the process and choose Go to service(s) to see exactly which service is inside. Windows Update and BITS are common culprits.
- SearchIndexer.exe: rebuilds its index occasionally. Let it finish. If it never stops, reduce indexed folders in Indexing Options.
Branch 2: Sustained High CPU at Idle (Telemetry, Sync, Startup Bloat)
If your CPU is busy even when you’re doing nothing, the cause is usually background work you never asked for. Open Startup in Task Manager. Disable anything you don’t need within 10 seconds of boot.
Look for OneDrive, Dropbox, Steam, Spotify, and manufacturer utilities.
Then check services. Type services.msc and look for third-party entries set to Automatic. Common offenders include Razer Synapse, iCUE, Armoury Crate, and OEM update tools.
Set them to Manual if you don’t use them daily.
Disable Windows telemetry where permitted: Settings > Privacy & Security > Diagnostics & feedback. Set diagnostic data to Required only.
Branch 3: 100% CPU with Slow Speed (Thermal Throttling, Dust, Bad Paste)
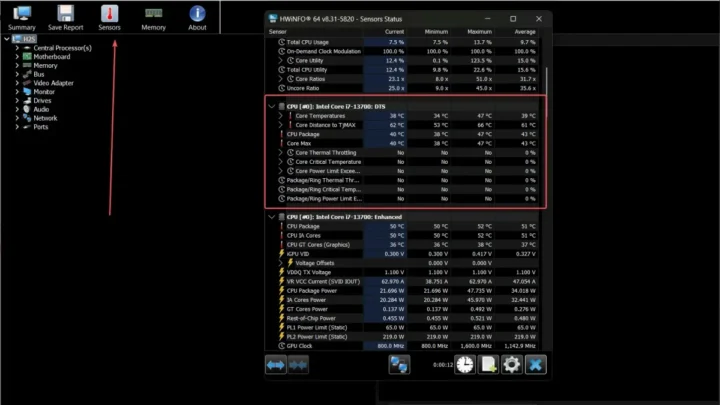
If CPU shows 100% but the machine feels sluggish, the chip is likely throttling. Install HWiNFO or Core Temp and watch package temperature under load. Intel chips typically throttle near 95-100°C.
AMD Ryzen chips throttle near 90-95°C. Apple Silicon throttles around 105°C package temperature.
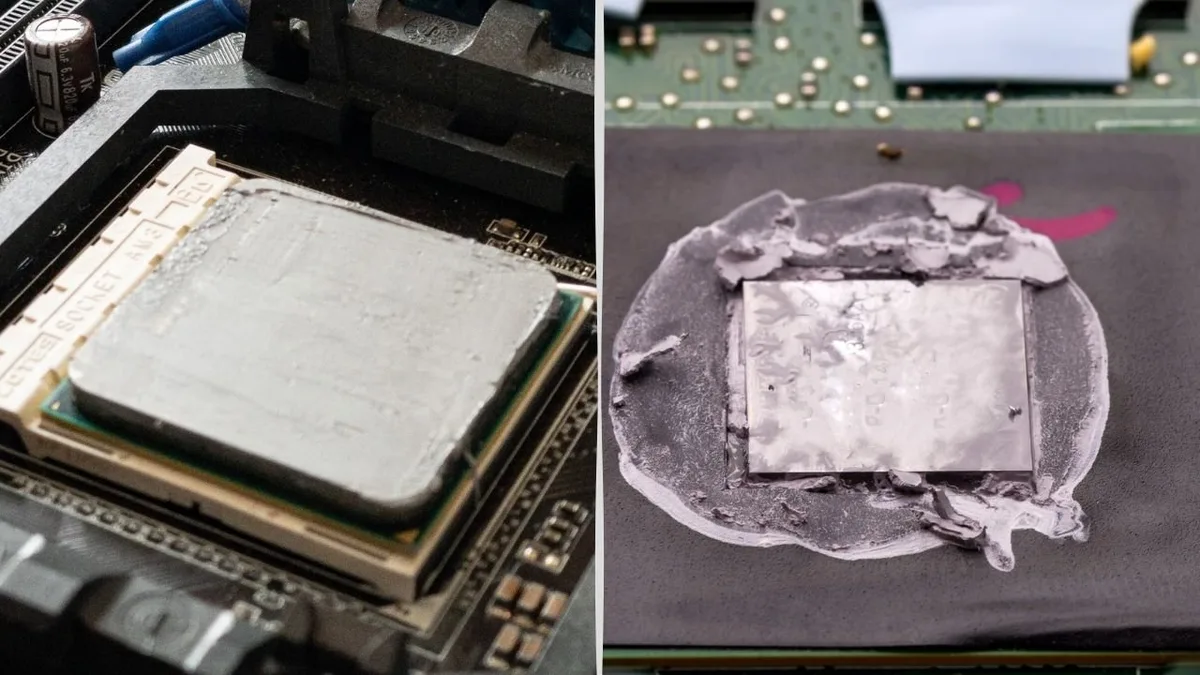
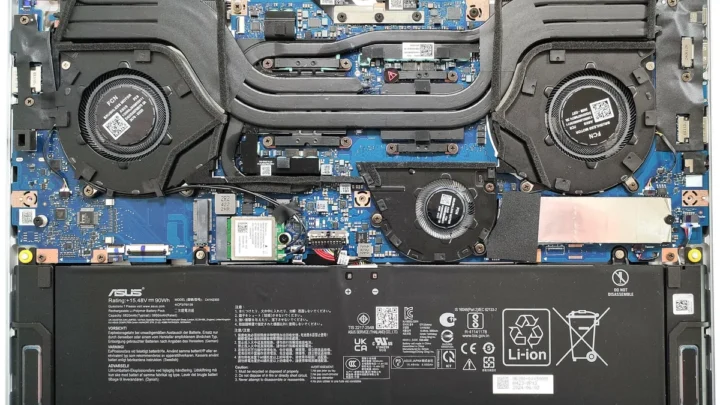
Check airflow first. Dust-clogged heatsinks are the number one laptop culprit. Blow out the vents with compressed air.
On desktops, verify the CPU cooler is seated and the fan spins. If the machine is 4+ years old, repasting the CPU with fresh thermal compound can drop temperatures 5-15°C.
On Windows laptops, set the power plan to Balanced or High performance, depending on whether you’re plugged in. macOS users can disable Low Power Mode if the CPU is throttling under load.
Branch 4: Mystery Load, DPC Spikes, or Suspicious Processes (Malware, Drivers, Cryptojacking)
If Task Manager shows high usage but no obvious app, the CPU is likely being hijacked. Cryptojacking scripts mine cryptocurrency in the background. They hide inside browser extensions, cracked software, and injected web ads.
Run a full scan with Microsoft Defender. For an offline scan, use Windows Defender Offline Scan from Windows Security. Then check Autoruns (Sysinternals) for suspicious startup entries.
Remove anything signed by an unknown publisher.
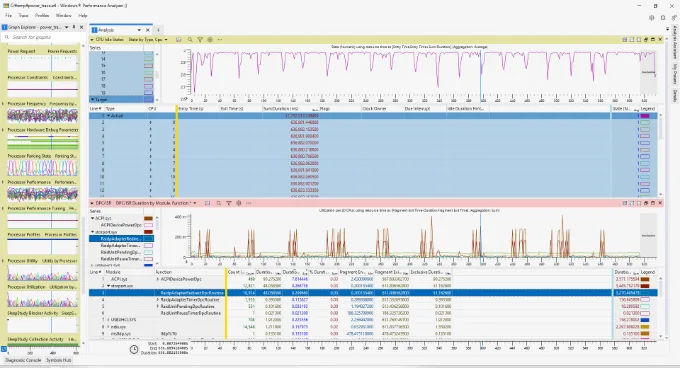
If DPC/ISR time is spiking in Resource Monitor, a driver is the problem. Update your GPU, chipset, network, and audio drivers from the manufacturer’s site. Per the Cybersecurity and Infrastructure Security Agency (CISA), keeping drivers and OS patched is the primary defense against exploitation that often manifests as hidden CPU load.
If a specific driver keeps misbehaving after updates, roll it back using Device Manager > Properties > Driver > Roll Back Driver.

Similar Posts