How to Check Your CPU Temperature: Easy Guide
We've all been there. A new build, a hot laptop, or a PC that suddenly sounds like a jet engine, and you start wondering if your CPU is cooking itself. Learning how to know cpu temperature is the first step toward a quiet, stable, long-lasting machine.
But here's the catch: the number you see depends on your chip, your cooler, and your workload.
Manufacturer specifications from Intel and AMD set clear thermal ceilings, called TjMax, and they vary wildly. An Intel Core i9 can sit happily near 100°C under load, while older chips throttle much earlier. So before you panic, let's figure out what your CPU is actually running at, and whether it matters.
how to know cpu temperature
You can read CPU temperature using free software tools, your BIOS, or built-in OS utilities. On Windows, HWiNFO64, HWMonitor, and Core Temp are the standards. Ryzen Master covers AMD chips, while Intel XTU handles Intel.
On Linux, run lm-sensors. For Apple Silicon, third-party apps like TG Pro work best. The key is checking "package" or "Tj" temperature, not your motherboard reading.
The Short Answer: What Normal Really Looks Like
Normal CPU temperatures sit between 30°C and 50°C at idle and 60°C to 85°C under heavy load. Modern chips are built to run hot. Intel's 12th through 14th gen parts and AMD's Ryzen 7000 series both boost aggressively until they hit their thermal limit, so a gaming session pushing you to 90°C is often by design.
That said, context matters more than the raw number.
- Idle (nothing running): 30°C to 45°C on a desktop. Laptops run warmer, often 40°C to 55°C.
- Gaming or light load: 60°C to 80°C is healthy. Laptops may edge toward 90°C.
- All-core stress tests: 85°C to 95°C is common and acceptable on modern chips.
- Danger zone: anything sitting within 5°C of TjMax for extended periods. You're losing boost clocks and shortening the chip's life.
The single biggest mistake people make is comparing their temps to someone else's build. A Ryzen 7 7800X3D and an i9-13900K behave nothing alike. Your cooler, case airflow, and ambient room temperature all shift the number, sometimes by 10°C or more.
Why Your Chip's Temperature Number Isn't Universal
Chip architecture drives thermal behavior. AMD's Ryzen 7000 and 9000 series are designed to run at 95°C under load, and AMD has publicly stated this is intentional. Intel's recent chips target 100°C before throttling.
Meanwhile, Apple Silicon uses a lower-power architecture that rarely exceeds 80°C in normal use.
So a "hot" reading on one chip is perfectly fine, while the same number on an older CPU would signal a serious problem. Always cross-check your reading against your specific model's TjMax. Intel's official ARK database and AMD's product pages list this value per chip.
The Three Ways to Read CPU Temperature (And Which One to Trust)
There are three reliable ways to see your CPU's temperature, and they don't always agree. Software tools read a digital thermal sensor (DTS) baked directly into the CPU die. That sensor is the most accurate source for core temperature.
BIOS readings, by contrast, only capture idle temps because you can't stress the chip while sitting in a setup menu.
Here's how the three options stack up:
- BIOS/UEFI hardware monitor: accurate for idle, useless for load testing.
- Windows software (HWiNFO64, HWMonitor, Core Temp): the practical choice. Real-time, detailed, per-core readings.
- macOS and Linux tools: workable but less detailed. Linux's
lm-sensorsis reliable once configured.
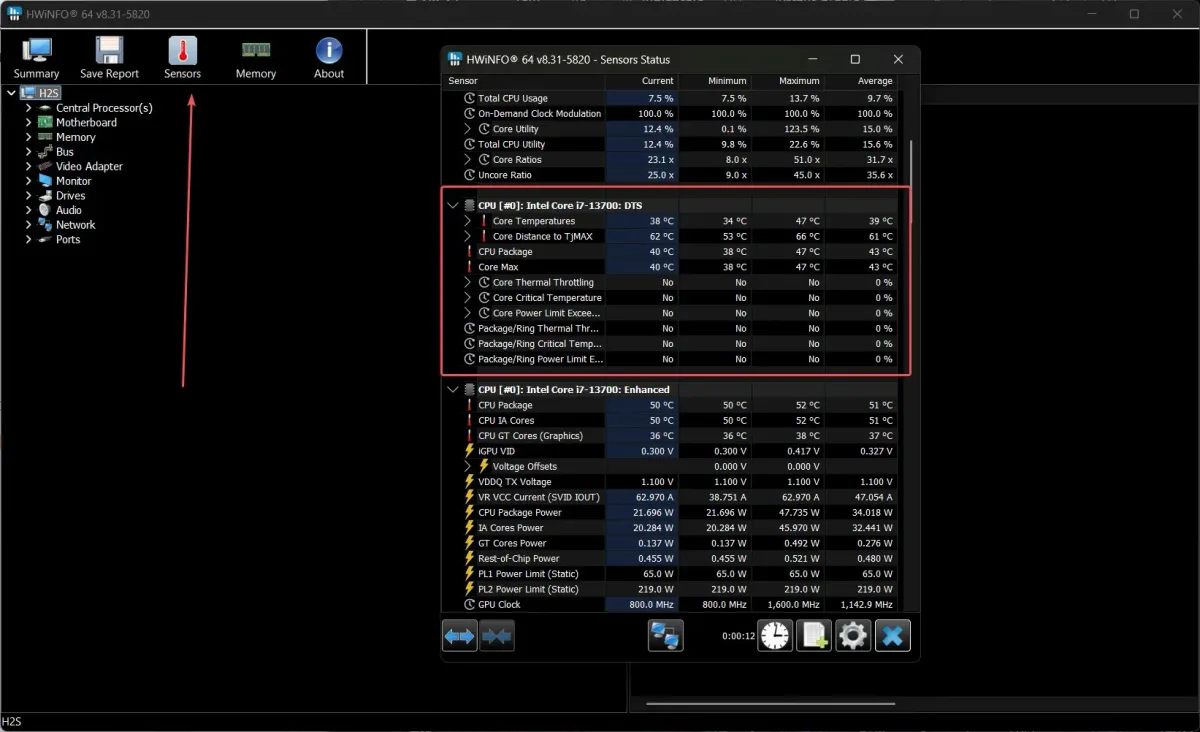
If you want one recommendation: install HWiNFO64 on Windows. It's free, shows per-core, package, and distance-to-TjMax values, and it plays well with every modern chip.
BIOS/UEFI Hardware Monitor
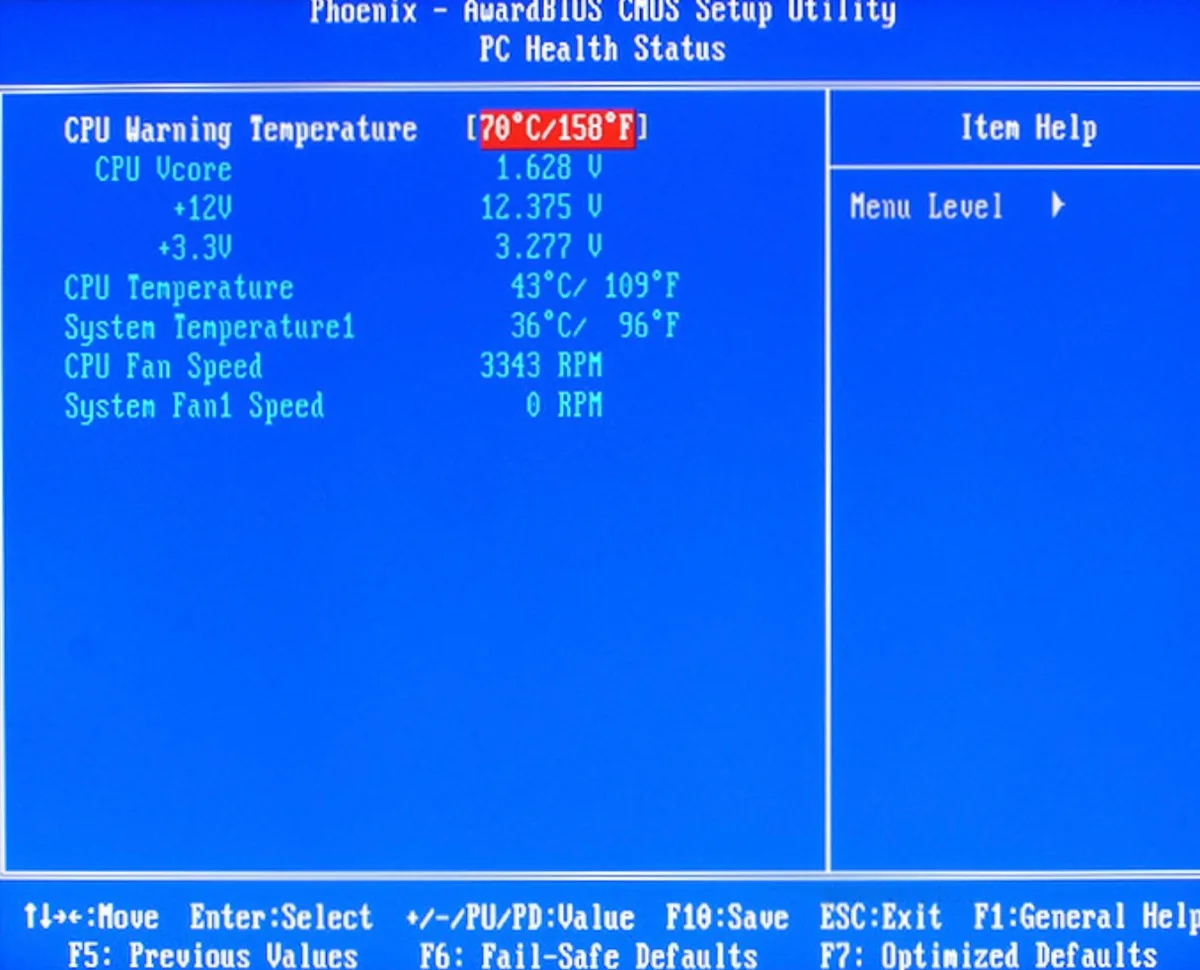
The BIOS monitor is your first stop after building a PC. Restart your machine and tap Delete, F2, or F12 during boot, depending on your motherboard brand. Look for a "Hardware Monitor," "PC Health," or "H/W Monitor" tab.
You'll see CPU temperature, fan speeds, and voltages.
Use it to confirm the cooler is seated and the fan spins. If your idle temp in BIOS is already 70°C or higher, something's wrong. Maybe the cooler isn't mounted properly, or thermal paste coverage is poor.
Fix that before booting into Windows.
Just remember, BIOS only shows idle. It can't tell you how the chip behaves under real work. For that, you need software.
Windows Tools: HWiNFO64, HWMonitor, Core Temp, and Ryzen Master
HWiNFO64 is the enthusiast favorite. It shows package temperature, individual core temps, TjMax, and how much thermal headroom you have left. Install it, run it in "Sensors-only" mode, and leave it open in the background.
HWMonitor is simpler and lighter, good for a quick glance. Core Temp is minimal and great for a dedicated always-on overlay. On AMD systems, Ryzen Master gives you the most accurate per-core readings plus real-time voltage and clock data.
One tip from aggregate user reviews: run two tools side by side at first. If HWiNFO64 and Core Temp disagree by more than 3°C to 5°C, you likely have a sensor polling quirk or an older motherboard. Trust the tool that reads directly from the CPU's DTS.
macOS and Linux Options
Macs don't expose CPU temperature by default, but Apple Silicon users can install TG Pro or Stats to get per-core readings. On Intel Macs, the built-in powermetrics command via Terminal shows temperature, though it needs sudo access.
On Linux, install lm-sensors, run sudo sensors-detect, then type sensors in a terminal. The coretemp kernel driver reads each core's digital thermal sensor, and package temperature appears under the Package id 0 line. For a GUI alternative, Psensor gives you a clean desktop view.
What Counts as Safe, Hot, and Honestly Fine
Safe means staying below TjMax with enough headroom that the chip isn't throttling constantly. Modern CPUs protect themselves: they'll reduce clock speed as they approach TjMax, and if that isn't enough, the system shuts down via a hardware failsafe called THERMTRIP. So true thermal damage is rare.
What you lose with sustained high temps is performance and long-term chip lifespan.
Here's the practical breakdown by chip family. Values below reflect manufacturer specs as of 2026.
| Chip Family | TjMax | Safe Idle | Safe Load |
|---|---|---|---|
| Intel 12th–14th Gen | 100°C | 30–45°C | 70–90°C |
| Intel Core Ultra | 105°C | 30–45°C | 70–95°C |
| AMD Ryzen 5000 | 90°C | 30–45°C | 65–85°C |
| AMD Ryzen 7000/9000 | 95°C | 35–50°C | 75–95°C |
| Apple Silicon M1–M4 | ~105°C | 30–45°C | 60–85°C |
Anything under those load numbers is normal. Anything hovering 5°C to 10°C below TjMax for long stretches means your cooler is at its limit.
When Throttling Kicks In
Throttling starts when the CPU gets within roughly 5°C to 10°C of TjMax. You'll see clock speeds drop, and in games or renders, frame rates and export times will sag. Check HWiNFO64 for the "Thermal Throttling" flag: if it's showing "Yes" during load, you've hit the ceiling.
Occasional throttling is fine. Constant throttling is not. It means the cooler can't move heat fast enough, and you're leaving free performance on the table.
Idle vs Gaming vs All-Core Load Ranges
Idle temps sit in the 30s to low 50s. Gaming typically pushes 60°C to 80°C on desktops. All-core workloads like Cinebench or Blender renders run hotter, often 80°C to 95°C.
On laptops, add 5°C to 10°C across the board. If your idle temps sit above 60°C, that's the red flag, not your load numbers.
Testing Your CPU Under Real Load, The Right Way
A single idle reading tells you almost nothing. You need to see how your CPU behaves when it's actually working. That means running a controlled load test, watching the temperature climb, and noting where it stabilizes.
The whole process takes about 20 minutes. Do it once after a build, after a cooler swap, or whenever your fans start sounding louder than they used to.
Idle Baseline Check
Boot into Windows, close every background app, and let the system sit for 10 minutes. Open HWiNFO64 and note the package temperature. That's your baseline.
Room temperature directly affects this, so if it's a hot summer day and your room is 30°C, expect idle temps roughly 8°C to 10°C higher than a winter reading.
Write the number down. You'll compare it against your load results.
Stress Testing With Cinebench, Prime95, and OCCT
For a quick check, run Cinebench R24's multi-core test. It's short, realistic, and most CPUs finish in under 15 minutes. Watch HWiNFO64's package temp during the run.
For a harder test, use Prime95's Small FFTs or OCCT. These push sustained all-core loads and will reveal cooling weaknesses fast. Run for 10 to 15 minutes and note the peak temperature.
Stop the test immediately if temps hit TjMax or you see throttling flags everywhere. That's your signal to improve cooling before pushing further.
Reading Per-Core vs Package Temps
Package temperature is the average across all cores, and it's the number to focus on. Per-core temps can vary 5°C to 15°C, especially on Intel's hybrid chips where P-cores and E-cores run at different voltages.
One hot core isn't usually a problem. But if one core sits 15°C+ above the rest under load, that can point to uneven thermal paste coverage. A repaste often fixes it.
When Temps Are Too High: Fixes in Order of Effort
If your temps are genuinely too high, start with the cheapest, easiest fixes before spending money. Fan curves cost nothing. Repasting costs a few dollars.
A new cooler is the last resort, not the first.
Work through the list below in order. Most people find their temps drop 5°C to 15°C before they ever touch the cooler.
Fan Curves and Case Airflow
Your fan curve decides how aggressively the cooler responds. Many default BIOS curves don't ramp fans until 80°C, which is too late. Use a tool like Fan Control on Windows or your BIOS's fan settings to build a custom curve:
- Below 50°C: 20% to 30% fan speed (quiet).
- 50°C to 70°C: 40% to 60%.
- 70°C to 85°C: 70% to 90%.
- 85°C+: 100%.
Then check case airflow. You want more intake than exhaust (positive pressure) to reduce dust, and at least one front intake and one rear exhaust fan. Cables blocking the front intake are a common culprit.
Repasting and Reseating the Cooler
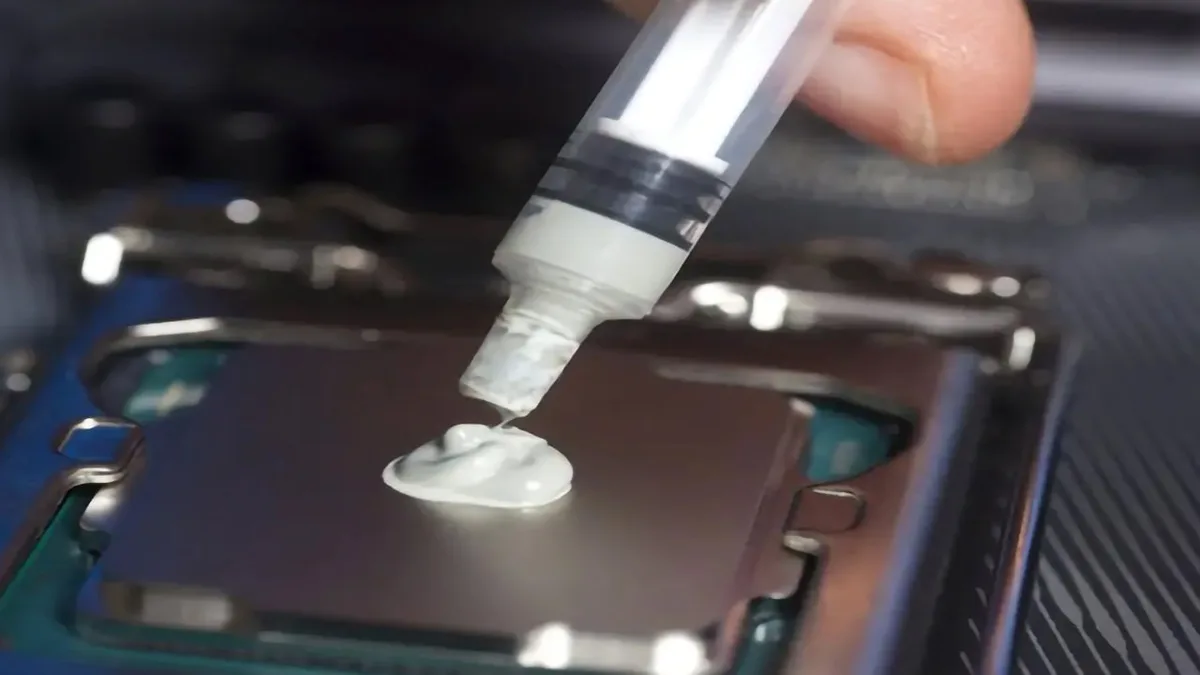
Thermal paste dries out and pumps out over time. Most pastes last 3 to 7 years, but high-heat chips can degrade it faster. If your temps crept up 10°C or more over a year, a repaste is likely the fix.
Here's the process:
- Power down and unplug the PC.
- Remove the cooler and wipe off old paste with isopropyl alcohol and a lint-free cloth.
- Apply a pea-sized dot of fresh thermal paste in the center of the IHS. For large chips like Threadripper, use a thin line or spread method.
- Reseat the cooler evenly, tightening screws in a diagonal pattern.
- Boot and recheck idle temps. You should see an immediate drop.
A poor mount, meaning uneven pressure or too little paste, is the single most common cause of abnormal temps on a fresh build.
Undervolting and Cooler Upgrades
If repasting and fan tuning don't cut it, try undervolting. Intel XTU and Ryzen Master both support offset voltage adjustments. Dropping Vcore by 50mV to 100mV can cut load temps by 5°C to 10°C with minimal performance loss.
If you're still throttling, it's time for a better cooler. Match the cooler's TDP rating to your chip: a 65W chip runs fine on a stock cooler, but a 125W or 250W chip needs a mid-tower air cooler or a 240mm+ AIO.
Mistakes That Make People Panic (Or Damage Their Chip)
Most thermal "emergencies" come down to a handful of misreadings. Fix these habits and you'll stop chasing problems that don't exist.
Misreading Tcase vs Tjunction
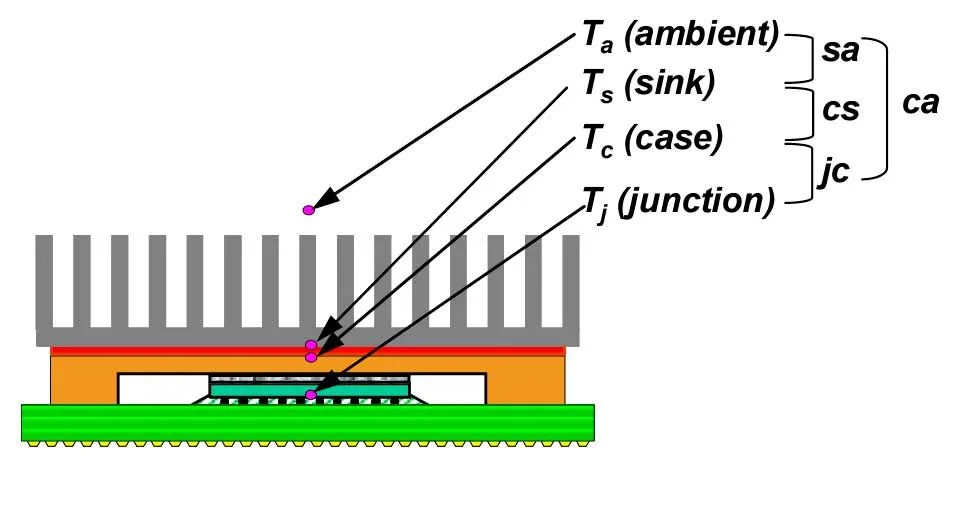
Tjunction (Tj) is your core temperature, and it's the number monitoring tools show you. Tcase (Tc) is the temperature at the top of the integrated heat spreader, which runs 10°C to 20°C cooler. Comparing your Tj reading against a reviewer's Tcase number will make you think your chip is overheating when it's perfectly fine.
Always match the number to its source. Software tools report Tj. Only a physical probe measures Tcase.
Trusting One Tool's Numbers Blindly
A single tool can be wrong. Sensor polling quirks, outdated motherboard firmware, and bad driver handoffs all cause false readings. In our research, cross-checking two tools catches discrepancies that a single readout hides.
If HWiNFO64 and HWMonitor disagree by more than 5°C, don't panic. Verify with BIOS at idle, then trust the tool reading directly from the CPU die.
Ignoring Ambient Room Temperature
Every 1°C rise in room temperature pushes CPU temps up by roughly the same amount. A build that idles at 38°C in winter can sit at 48°C in summer without anything being wrong.
If you're troubleshooting a "hot" CPU in July, measure the room first. Anything above 25°C ambient explains a lot.
Running a Dying AIO Pump Without Noticing
Liquid coolers fail quietly. When the pump dies, temps spike within seconds of load, often jumping from 40°C to 95°C almost instantly. Air coolers degrade slowly by comparison.
Watch for the pattern: sudden, sharp temperature climbs under even light workloads. That's a pump failure, not a paste issue. RMA the cooler before it takes the CPU with it.
What This Means for Laptops and Small Form Factor Builds
Laptops and SFF PCs live under tighter thermal budgets. Their coolers are smaller, airflow is restricted, and manufacturers often tune chips to run hotter on purpose. A laptop CPU sitting at 85°C under load isn't broken.
It's working as designed.
What matters is sustained throttling, not peak numbers. If your laptop holds boost clocks through a long render, the thermals are fine. If it drops to base clock within two minutes, cooling is the bottleneck.
Aggregate user reports show three fixes help most laptops:
- Undervolting drops load temps 5°C to 12°C on most Intel and AMD mobile chips.
- Cooling pads shave 3°C to 8°C by improving intake airflow.
- Repasting with liquid metal or high-viscosity paste can gain 5°C to 10°C, though it voids warranties on some models.
For small form factor desktops, the same logic applies. A 65W chip in a well-vented SFF case runs cool. A 125W chip in the same case will hit the thermal limit.
Match your CPU's TDP to your case's realistic cooling capacity, not its marketing specs.
The 95°C your laptop hits in a benchmark isn't a warning sign. The 95°C it holds for an hour during a video export is.
Frequently Asked Questions
What is a normal CPU temperature?
Normal idle temps sit between 30°C and 50°C. Under load, 60°C to 85°C is healthy for desktops. Laptops run 5°C to 10°C warmer.
Anything below your chip's TjMax with no throttling is fine.
Is 90°C too hot for a CPU?
Not always. Modern Intel and AMD chips target 95°C to 100°C under load. Ryzen 7000 and 9000 series are designed to run at 95°C.
If you're not throttling, 90°C is acceptable.
How do I check CPU temp without software?
Enter your BIOS or UEFI at boot and open the hardware monitor tab. It shows idle CPU temperature, fan speeds, and voltages. You can't test load temps this way, though, since the CPU isn't working hard.
Why does my CPU temp spike to 90°C instantly?
A sudden jump from idle to 90°C under light load usually means an AIO pump failure or a loose cooler mount. Check that the pump is running and the cooler is tightened evenly. Repaste if the mount looks fine.
Does high CPU temperature damage the chip?
Rarely. CPUs throttle and then shut down via THERMTRIP before reaching damaging levels. Sustained high temps mainly cost you performance and long-term lifespan, not instant failure.
What's the difference between TjMax and Tcase?
TjMax is the maximum junction temperature of the CPU cores, typically 90°C to 105°C depending on the chip. Tcase is the surface temperature of the heat spreader, which runs 10°C to 20°C cooler. Monitoring tools report Tj, not Tcase.

Similar Posts